Pretty similar. The 2k:6k ratio seems to be the source of a lot of the psychoacoustic “soundstage,” the kind attributed to, e.g., the 800S. (The other kind of soundstage, IMO the more important one, is the kind you hear in a recording made for example in a church, which captures the sound and character of the performance space, and I don’t know what frequencies are important to that sort of reproduction; perhaps that’s more about time differences.)
1 Like
Like literally “literally”? What a shame. What a bummer.
Averaging is sometimes poo-pooed on forums like this. Sometimes for good reasons, and sometimes for not so good reasons. I sometimes find it a useful tool though for better understanding some of the complex resonant behaviors of different audio devices.
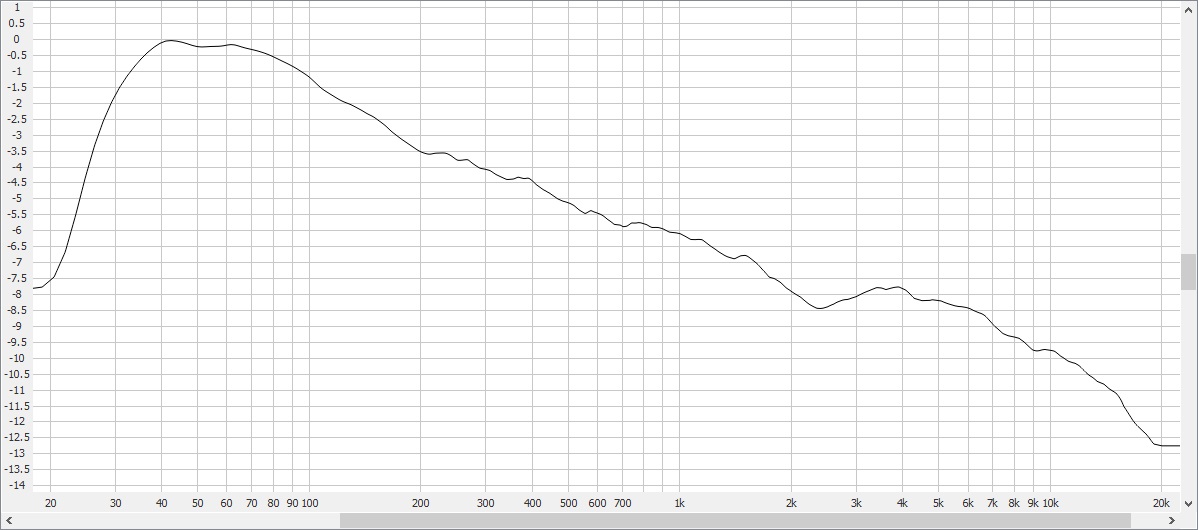
This curve represents the average sound power response of a fairly large sampling of different loudspeakers with a flat direct response.

Sound power is one of the components Harman uses to estimate a speaker’s in-room response. And it gives a good idea of what frequencies are more or less emphasized in a typical semi-reflective room. Ideally, the sound power response of a loudspeaker should be pretty close to a linear slope from the F0 resonance in the bass down to the treble. When you start looking at larger samplings of speakers though, it starts to look more like the curve above, with a little dip at around 2k or so, and a bump centered around 6k.
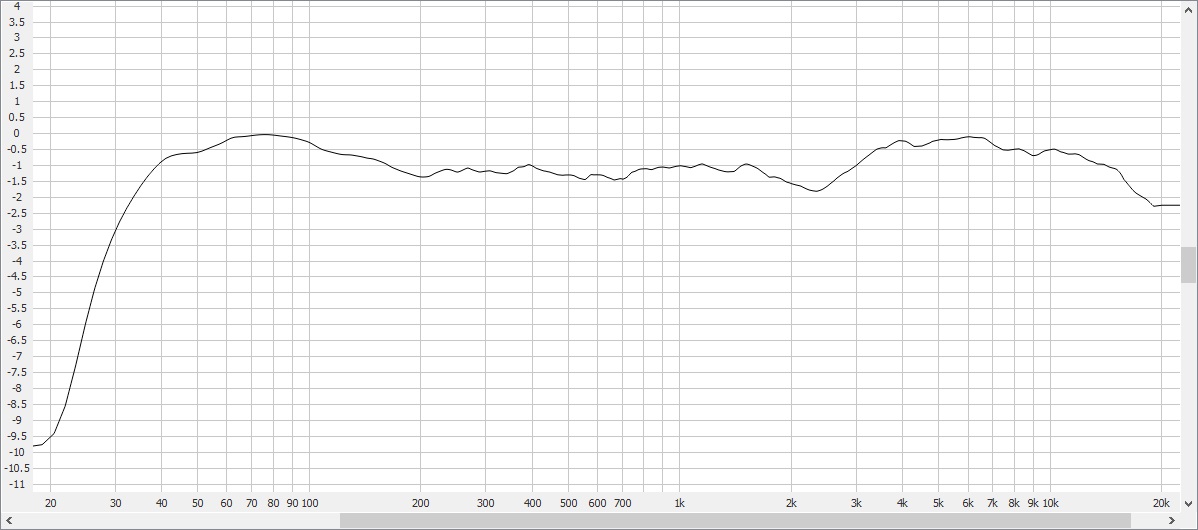
The dip at ~2k is where the midrange driver and tweeter cross over. And the bump at ~6k is the resonant frequency of the tweeter. These features are a little easier to see and distinguish if you remove the slope from the SP curve, which can be done by applying an inverse slope in the +1.0 to +1.5 dB per octave range to the curve.

There is also a little bump in the bass as well, at the resonant frequency of the woofer. (This starts to become more obvious when looking at smaller samplings of speakers, with their own built-in subs. And is usually centered somewhere around 60 Hz, or the resonant frequency of a kickdrum.)
The emphasis in the 6k range is usually no more than a dB or two. And the dip at 2k is probably a bit less on average. Newer speakers with a more linear off-axis response will tend to smooth most of these broader band bumps and dips out though, providing better tonal consistency with the speaker’s flat direct response.
1 Like
Interesting. Are these images available with a scale on the y-axis? I’d like to see how much of a relative difference is shown.
It’s not as easy with the larger sampling above. But I can give you an idea with a smaller sampling of 10 better extended speakers, where its easier to calculate the dBs. The resonance in the bass is also becoming more obvious here as well.
SP SLOPE INTACT:
SLOPE REMOVED:
Another sampling of 10 speakers that are not as well extended in the bass, but show the tweeter resonance in the treble a bit better.
SP SLOPE INTACT:
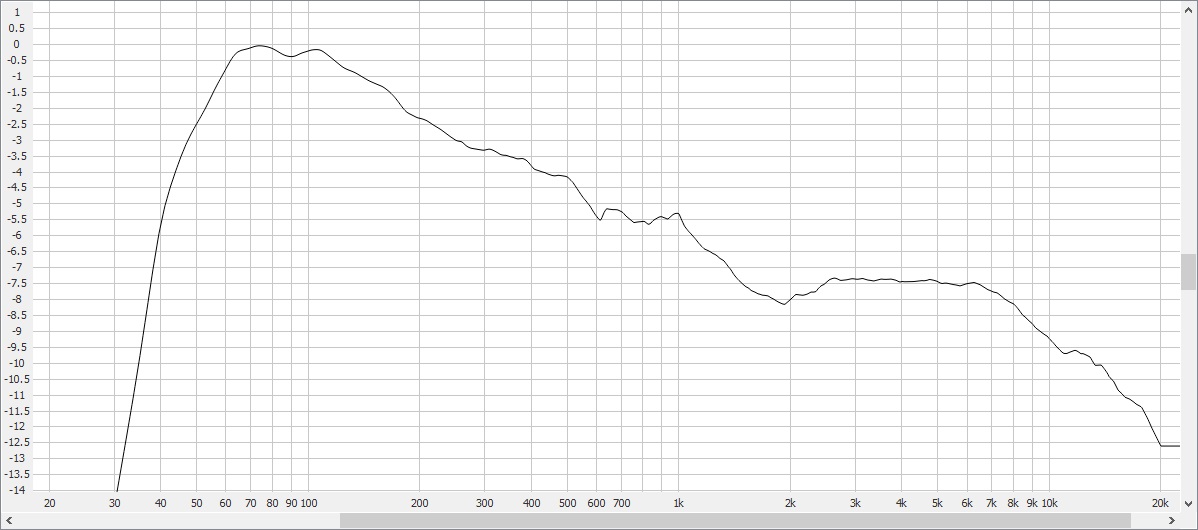
SLOPE REMOVED:

1 Like
Thank you!
Pardon my ignorance, but what does the slope represent?
A very good question.
Sound power represents the diffuse frequency response of a speaker going in all directions in a room. This is distinct from the speaker’s direct/on-axis response. And also its in-room response, which contains elements of both a speaker’s direct and diffuse (SP) responses, as well as its early reflections. In the Harman model, sound power stands in for a speaker’s late room reflections.
The reason the diffuse or sound power response is more elevated in the bass than in the treble (forming a slope) is that most speakers radiate sound more broadly at lower frequencies than at higher frequencies. This means that the speaker’s diffuse reflected energy in the room will tend to favor the bass more than the treble.
For more on all of this, I recommend watching this video by Dr. Toole.

OK, here’s another great comparison. I don’t go looking for closely tracking squiggly lines, I swear! ![]() And I didn’t even intend to do this comparison, but I ended up listening to the Focal Utopia (2022) and then the Drop/Sennheiser HD58X, one after the other, and I thought, “Wow, these sound pretty close!” And here are the lines:
And I didn’t even intend to do this comparison, but I ended up listening to the Focal Utopia (2022) and then the Drop/Sennheiser HD58X, one after the other, and I thought, “Wow, these sound pretty close!” And here are the lines:
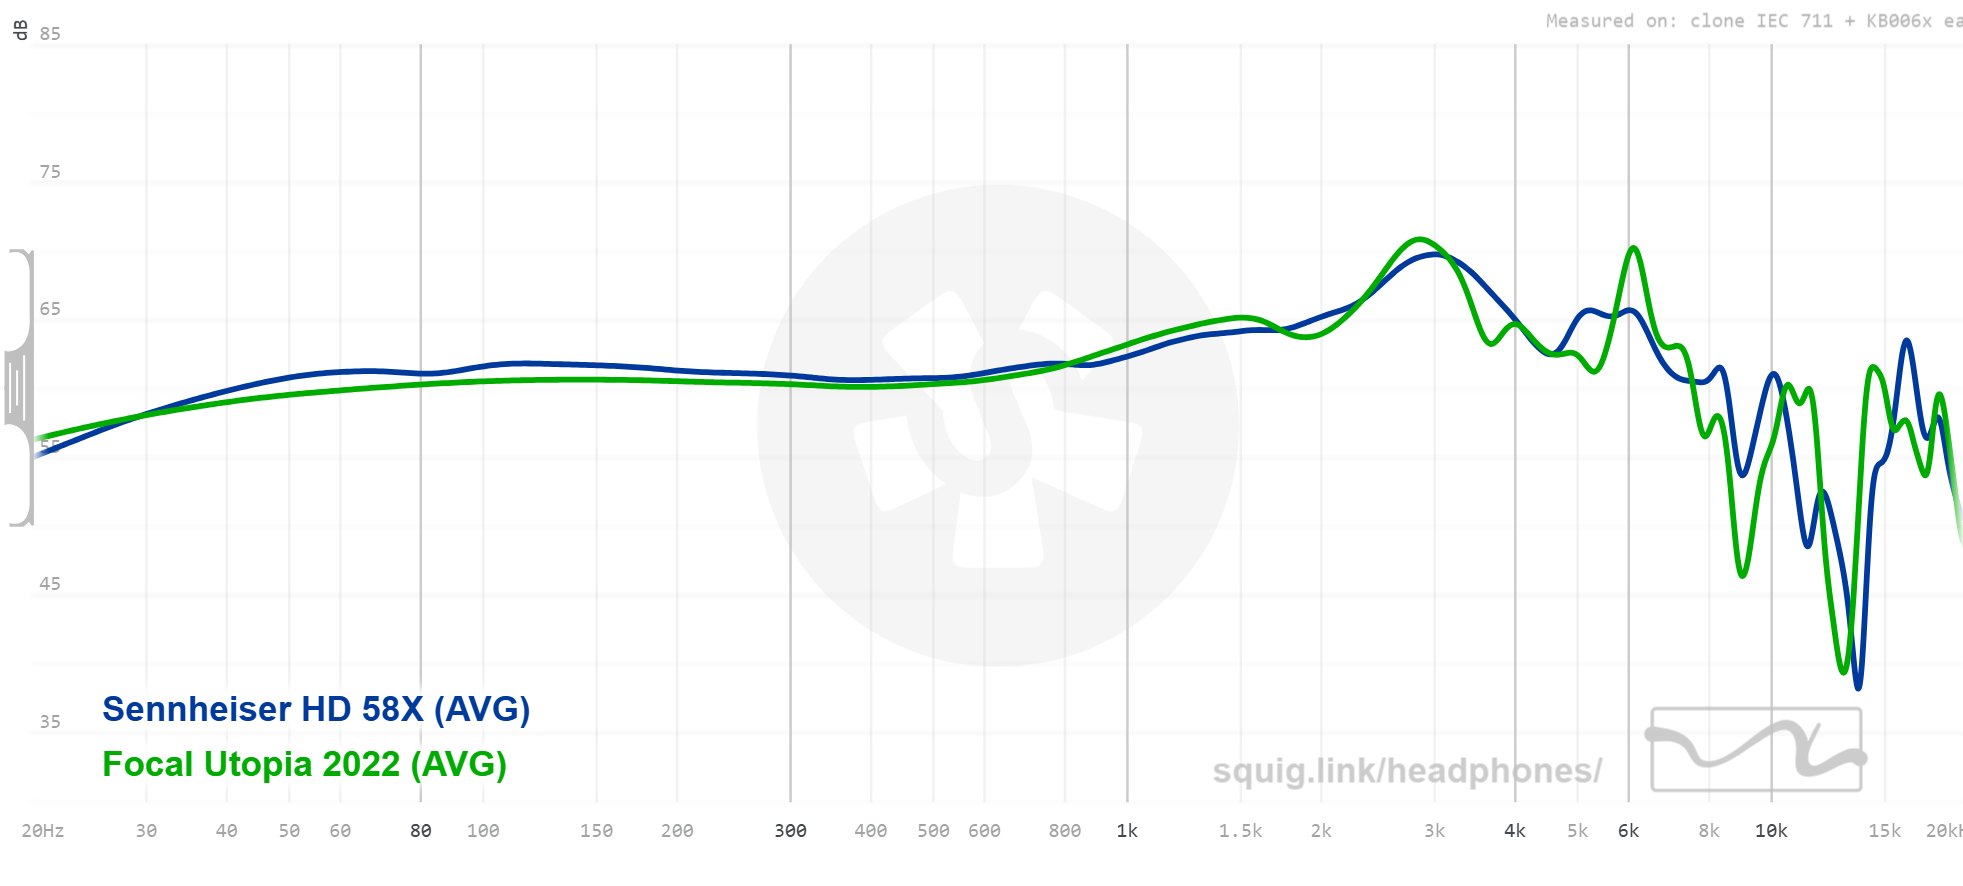
You can see there are microdivergences under 1.5k. While I’m not going to dispute that some might be able to hear them, I also suspect the difference in those levels is less important than whether your sinuses are clear. So I wonder if you could get a near match in tuning by just making three small adjustments, at just over 5k, at 6k, and at 8k. Above 8k there are some bigger differences for sure which could affect timbre, but those also are more widely varying across individuals as well. Has anyone tried this? Or heard these back to back?
Yes but not by graph. You’ll have to tune it by ear/alternating tones/sweeps.
Everyone’s resonances are different, you can’t go by any of these graphs to determine what to EQ in those regions, period.
1 Like
I’ve done back-to-back and extended multi-day comparisons across these price tiers. I compared the OG Utopia to the HD 600 for hours and hours, and then the HD 58X and 6XX later. To my ears the 58X and Utopia are not remotely on the same planet. The 58X is grainy and ‘digitized’ – it’s an uninteresting product and useful only for situations where I could not have a dedicated amp.
I dropped out of the recent EQ discussions because I’m not an EQ transformation “skeptic,” rather, I’m a flat out absolute 100% denialist. If you have nothing nice to say…
3 Likes
I don’t disagree, and I don’t do it myself. But isn’t that what most people are doing most of the time, fixing EQ settings to match a graph to a target?
1 Like
Yes, and it’s not a good way to go about achieving the best sound quality. It does help people who don’t have experience in identifying tonal qualities of particular headphones or know what to look for. This experience could be learned and built up by using tools such as Harman How to Listen, and sites like Audiotoolz. Highly recommend both if you want to learn how to EQ!
A better way to EQ is to measure your own HRTF and apply an EQ to correct for the resonances generated by the combination of headphones on your specific ears (even your own two ears will have their own differing responses). One way to do this is to use in ear mics. However the results from in ear mic’s produced EQs are only 10-15% more preferred than no EQ (https://aes2.org/publications/elibrary-page/?id=20605). It brings up the approval rating of the headphones from the 50-60% range to up to 60-70%. So it’s by no means perfect, and it doesn’t take into account of each individual’s listening preferences on top of their anatomy induced differences.
Another way to apply EQ that fits your own HRTF is to do listening tests using tones and sweeps. It works quite well but there are some down sides. In my opinion it’s still quite a good method and most definitely superior to not EQing, or EQing using profiles that match some target using measurements. I highly recommend people give this a try, but I’ll list the cons of this method.
The downsides are that there’s only a 0.5-1db precision in human hearing for comparing tone loudness, and the end results of such tonal smoothing across the frequency response range is not corrected to any standard unless you also match such tonal comparisons with calibrated flat speakers. And even if you do so, your own personal preferences for listening with headphones is obviously different than listening with speakers with Free Field sound characteristics. It also requires the listener to have a good understanding of tonal characteristics in order to develop a preference curve. I won’t get into the philosophical debates on how accurate the reproduced sound is, because that’s another different can of worms.
All that said, I’ll list the easiest to hardest EQ methods, which mirrors the least personalized to most personalized EQ methods:
Easiest → Hardest
- No EQ
- Add bass/treble shelves
- Use Sound ID type program that lets you A/B compare different audio clips with different EQs applied
- Use presets built using measurement rigs
- Use presets built using rigs but ignore adjustments above 5000hz or so since they certainly won’t match your HRTF
- Use presets and then use sweeps and tone comparisons to get rid of resonances above 5000hz
- Start from scratch and flatten all peaks and dips by ear, matching with flat speakers
- Start from scratch and flatten all peaks and dips by ear, and add back your own preference curve
Please use tools such as Harman How to Listen, and sites like Audiodrillz and learn what different frequencies EQed sound like. Learning that skill will make identifying tonal issues possible, on top of helping you develop a good sense of what sounds good to your own ears.
3 Likes
Regarding the first inquiry in making the HD6XX have a soundstage.
I have a pair and I cannot squeeze much soundstage out of those.
I of course EQ those as well as I don’t subscribe to using headphones without EQ at all.
The only thing I was able to do is get a bit better imaging/instrument separation.
All those Senn headphones are a bit scratchy on top and while not sibilant , some of the highs need to be tamed a bit. Then instruments feel a bit more solid.
But then again that’s on my own head.
Those headphones have a dead flat soundstage and I don’t know why.
Maybe it’s because the ear cups are flat and there are no reflections coming back to one’s ear in a manner which would add some ‘ ambience’ or a ‘ reverb’ like effect.
My Focal Clear OG are better in that respect , and maybe because of the rounded cup. But still it’s not an impressive soundstage.
My Beyer 1990 on the other hand have an amazing soundstage that is a little further out from your head and has really good layering.
I don’t know if that is because the cup geometry is such that some reflections come back to our ear in a manner that makes that soundstage. And the headphone is basically semi open as well. All those grills you see on the outside aren’t open.
But they do have a relatively deep cup which has no damping in it. Which might also add to that peak at around 8khz. But once you eq that part down, the rest is awesome.
Doing sweeps it has a smoother freq response from 2khz to 13khz than the Focals. The Focals have more cancelations above 4khz than the 1990.
I’m not saying the 1990 are better than the focal Clear btw. But their soundstage is definitely better.
2 Likes
You missed one of the easiest and most effective ways. Yes, sometimes I play with numbers and curves. I still find this more satisfying:
4 Likes
Me too. I just wish there was something with 2, 4, 6, 8, & 12k. But, not really available in the graphic EQ world.
1 Like
I really find the Lokius adequate for all but really specific purposes. And even though I may be listening to an already saved EQ profile, I don’t always agree with the recording engineer’s choices.
3 Likes
Pad material and pad wear renders EQ numbers irrelevant unless one replaces pads monthly. I do not know anyone who does that. The real world of music involves listening to actual music, not being a gearhead owned by a priori logic.
1 Like
Replacing pads often is not a bad idea. Some graphers measure new and worn pads though, which is helpful.
You could also do your own in-ear measurements when the pads are new. And re-measure from time to time to make some adjustments.
If your applications require a high level of precision, I suppose these kinds of things might be worth considering. If you’re doing most of your EQ adjustments by ear, then it probably doesn’t matter either way.
1 Like

One other suggestion. For basic tonal/timbral adjustments, I use a slope filter like the one above in EAPO. This is in lieu of shelf controls, which are a bit harder to set up and operate. And not as slopey (for lack of a better word).
The slope control above is from EAPO’s Configuration Editor. And it’s just a variable GEQ with two points at 20 Hz and 20 kHz. To reduce brightness, I lower the 20 kHz point, on the right. And to increase brightness (relative to the bass), I’d lower the 20 Hz point on the left. As long as you start with the two points at unity (0 dBFS) and do the adjustments this way, there’s no need to use/adjust a Preamp filter to prevent clipping.
To select the point I want, I drag a box around it with my cursor (multiple points can also be selected this way). And I move the points up or down in 1 dB increments using the up/down arrow keys on my PC’s keyboard. It’s pretty simple once you get the hang of it.
The points don’t have to be at 20 and 20k Hz btw. They can be at other frequencies if you prefer, depending on your sample rate. I find the 20-20 arrangement pretty simple and convenient though.
1 Like
This is a great suggestion. I use something very similar as well in my Equalizer APO. Sometimes different genres and recordings just need a bit of a general tilt +/- 0.5-2 db without adjusting all the fine tuned EQ settings in between.
1 Like