Really Excellent writeup @antdroid.
1 Like
Video from @Resolve on FR reading:

4 Likes
Crinacle’s Headphone Graph database just went live.
A bunch of headphones was remeasured with his newly acquired GRAS 43AG-7.
4 Likes
Guru’s. Same principle, but speakers.
I have a calibration micorphone here that comes with the IK Multimedia MTM monitors they use to calibrate the room.
Is there a free easy software to use this mic, plugged into PC, test tune through my new KEF LS50W II and graph the response? Which I can then use to see whats going on with the room to a degree, and make my own EQ profile accordingly?
1 Like
Or just the test track and I’ll try do it by ear, see if any particular frequency resonates or feels disproportionally loud.
1 Like
You can use REW but you will need the calibration for the mic.

Update: This was updated to reflect a new calibration file that more accurate represents the lower treble region of the curve for headphones – thanks to Crinacle!
A couple years ago, I hand-sketched a target curve in Microsoft Paint and called it my Antdroid Target. It was partially a joke, but it actually was semi-based on what I thought what I considered neutral. This ended up being very similar to the Moondrop Blessing 2 when it came out, though that IEM is probably a touch brighter.

Since then, I wanted to come up with what I thought would be an ideal preference curve for in-ear monitors and later headphones. Fast forward a bit, and this year, I upgrade my IEC-60711 coupler to a new version of the knock-off GRAS unit, and added an ear and cheek simulator to the coupler microphone, and am now able to make headphones and IEM measurements that are pretty comparable to industry research.
**Please note that this isn’t taken with an official GRAS RA0045 + ear/cheek sim but I’ve compared my headphone measurements to others and it’s pretty close, and maybe 1-2dB off in treble. (usually a little less, but could be effects of pad wear and silent revisions – Hifiman!!)
I’ve measured hundreds of IEMs at this point and a few dozen headphones and had a pretty good idea of what my preference targets were, but I wanted something I could use to compare to other headphones and to just have a target equalizer setting to work to. So I came up with an approach to come up with the Antdroid Target Curves.
It was quite simple actually. I took my favorite IEMs and Headphones I owned, measured them carefully and then took an average of each population and then made tweaks as necessary.
Easy! Let’s see how it turned out!
Headphones
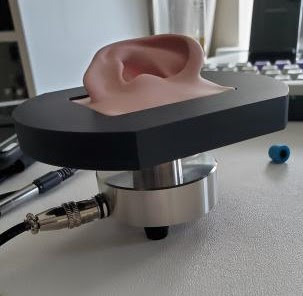
I came in thinking that my preference target was pretty much a flat bass and midrange to about 1KHz and then a rise similar to the Harman/Diffuse Field target with a little reduced gain and then a smoothed out treble response. The results were pretty close!
I used a combination of headphones that measured pretty differently. In this case I used my flagship and warm ZMF Verite with BE2 Leather pads, the brighter Hifiman Arya, the punchy Denon D5200, the portable Audeze Sine, and the legendary reference headphone: the Sennheiser HD600.
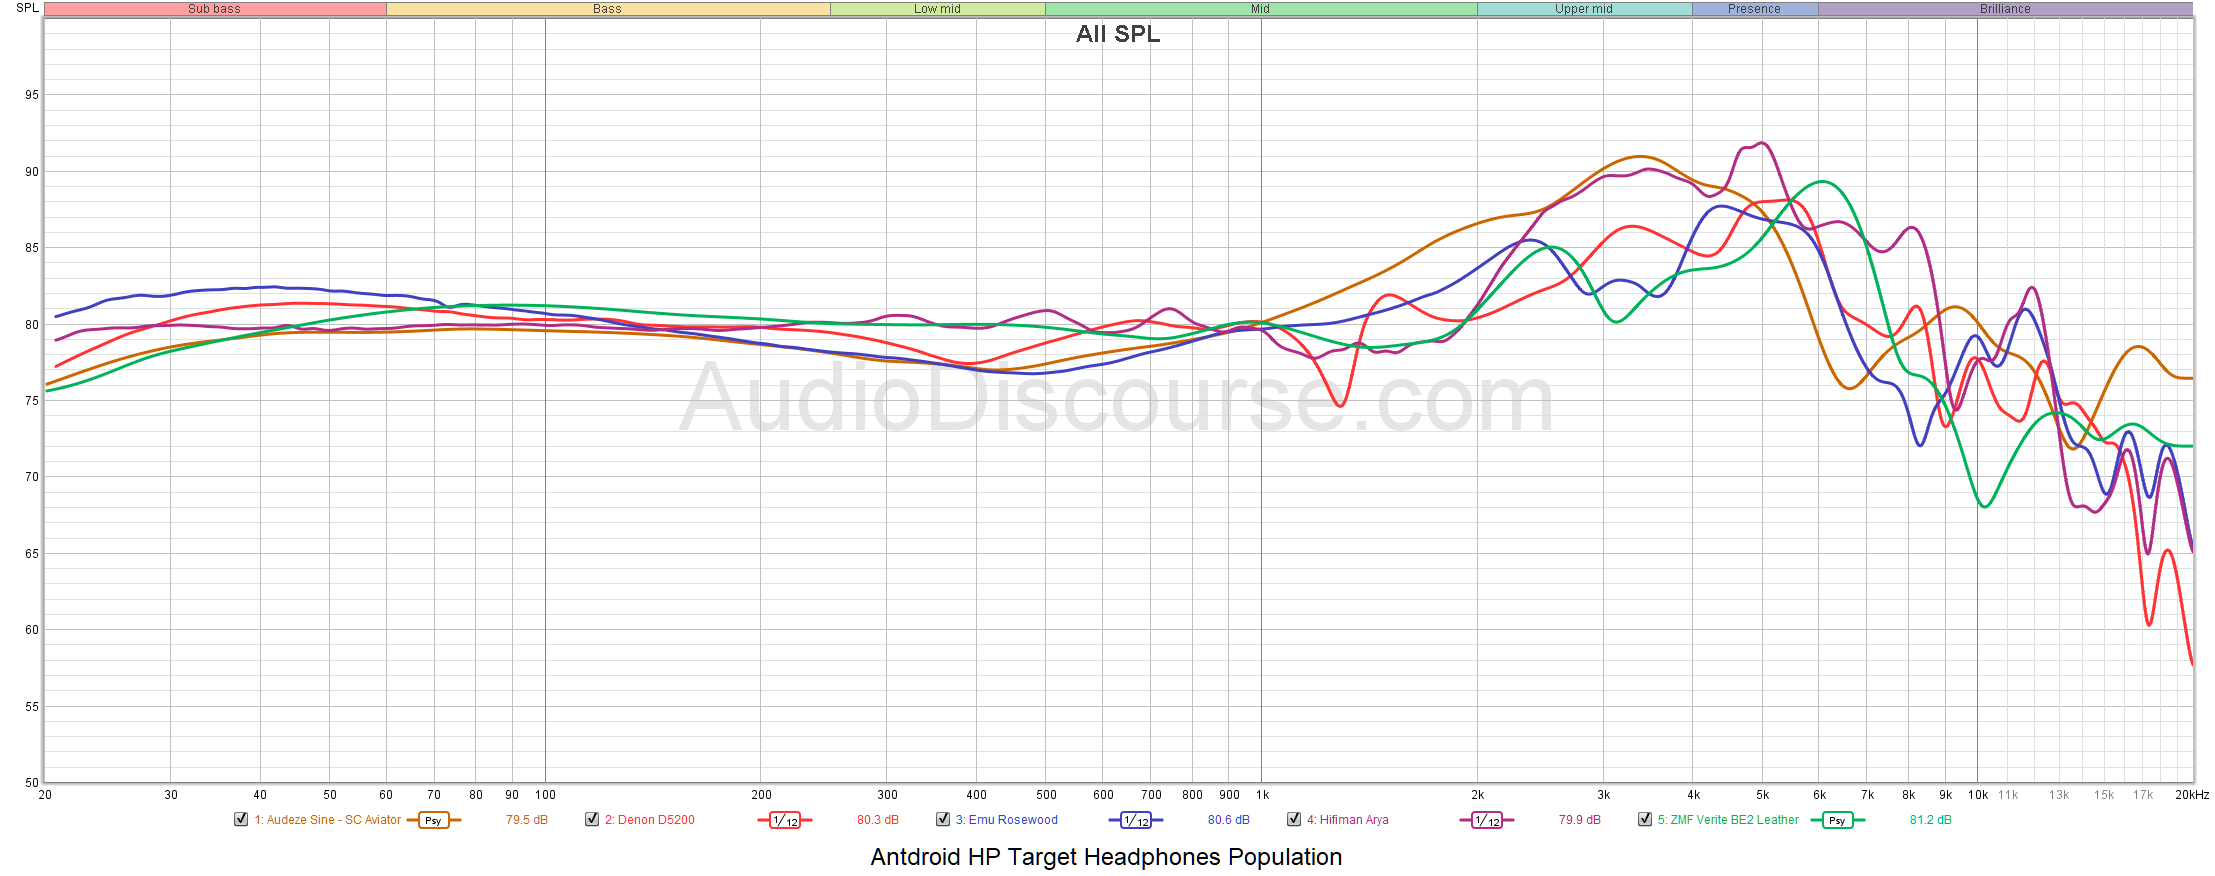
Once I aligned all these varying measurements and took an overall average, it came up with a nice looking curve that was basically what I was expecting. The average graph below is smoothed out a bit to make it more presentable, but it falls in line with exactly what I thought it should be. It is plotted below with the current 2019 over-ears target from Harman International’s headphones research.
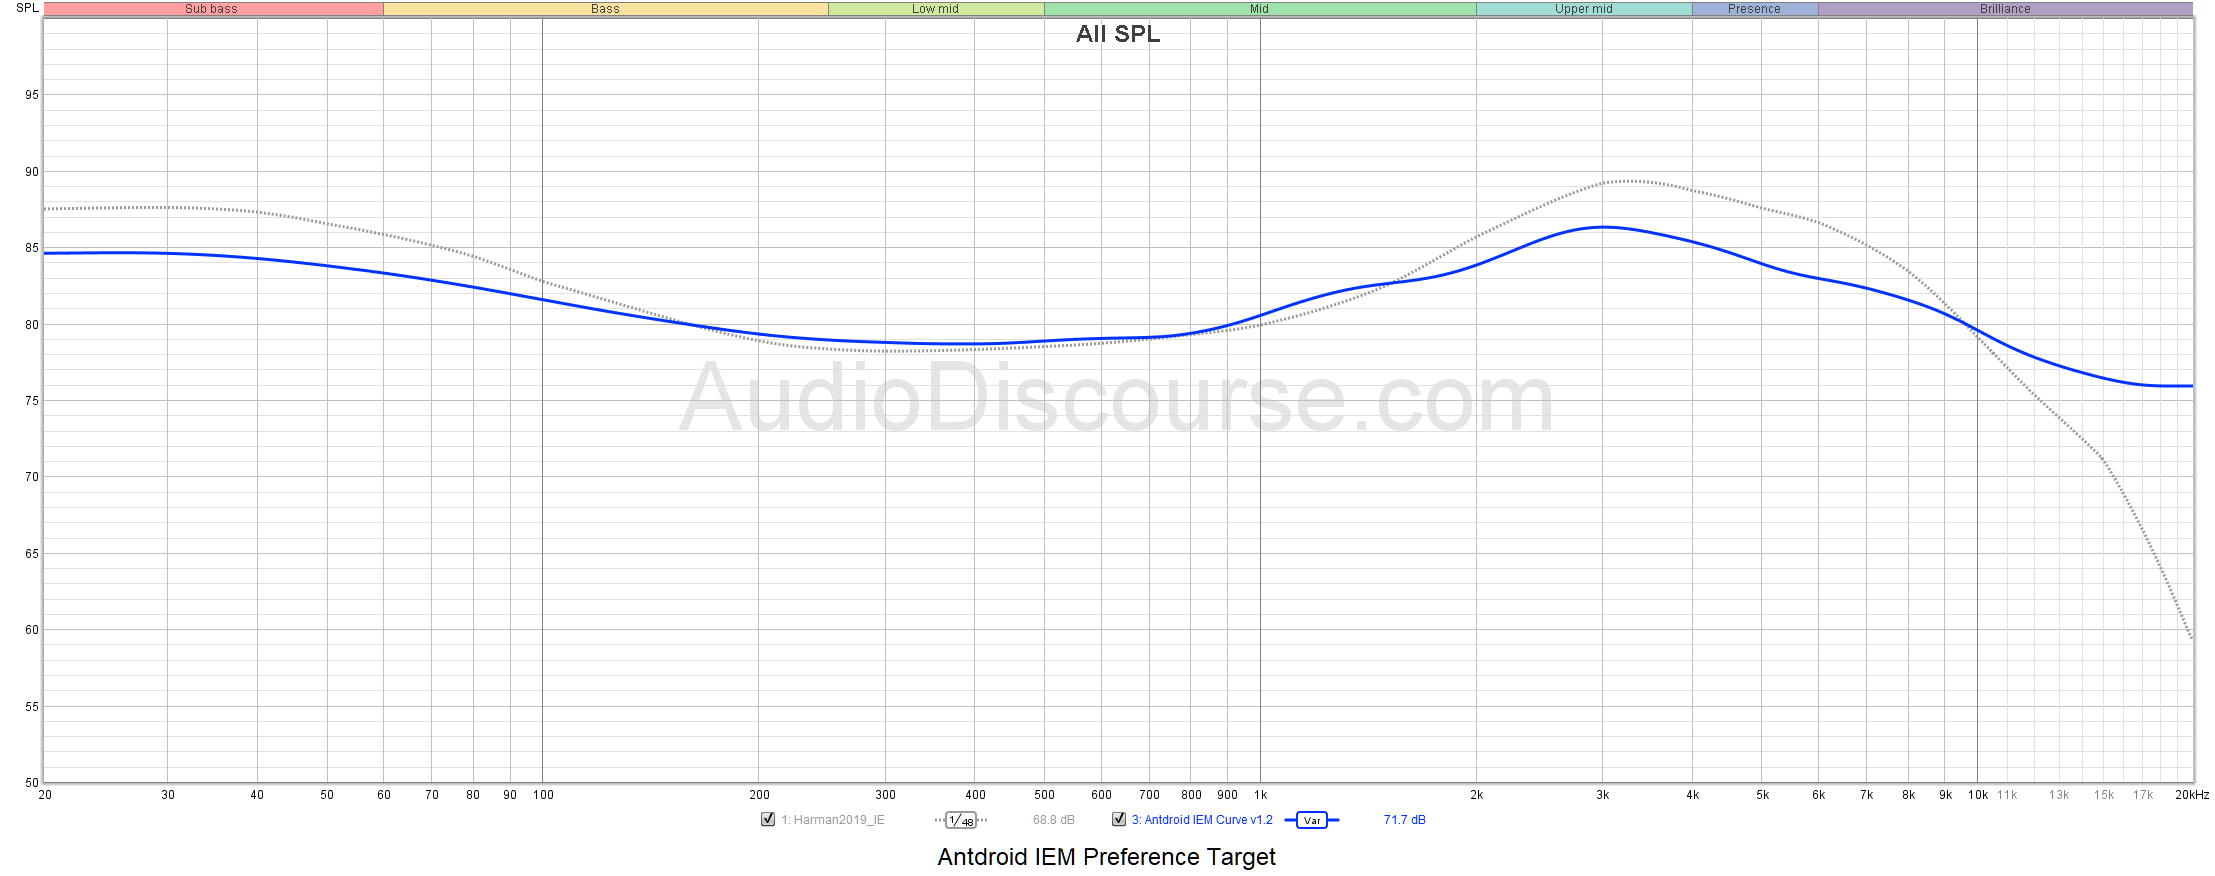
In-Ear Monitors
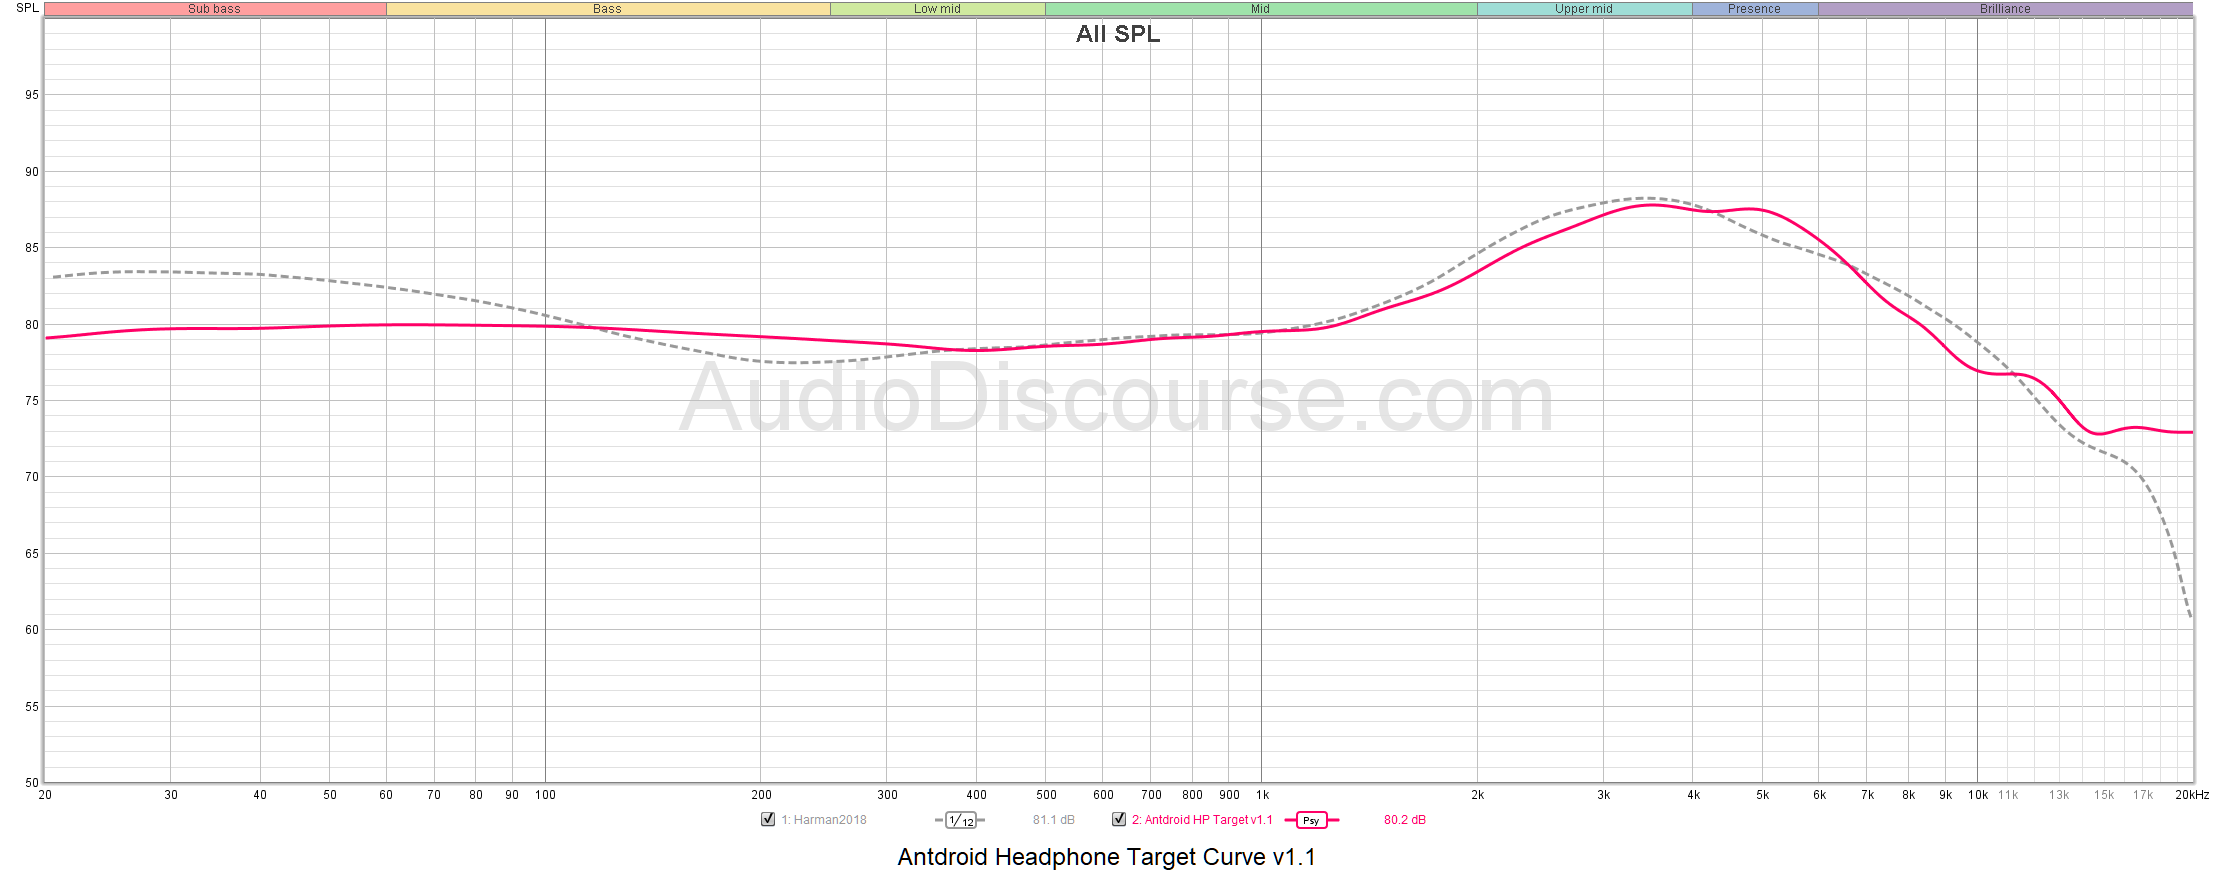
For IEMs, my own set of IEMs are actually very similar to each other for the most part. That is until I got the Unique Melody MEST, which is a little warmer and laid back then the other ones that are more or less some sort of modern Etymotic-curve based IEM with bass-shelf.
For all of these measurements, I used custom versions of the IEMs because that’s what I own and prefer. So the basic target generated was really meant for CIEMs. That said, for the most part, these IEMs measured the same for the universal as the custom model up until about 6KHz or so in the treble region, so much of the target can be used for universals as well. On top of that, I smoothed out and reduced the upper treble to factor in the resonance peaks and universal fit so that this could work with either customs or universals more effectively.
Like the headphone target, my predictions for the IEM target was very spot-on to what I suspected it would be and I am pretty happy with how it turned out. The results are below with the 2018 In-Ear Target from Harman International in gray.
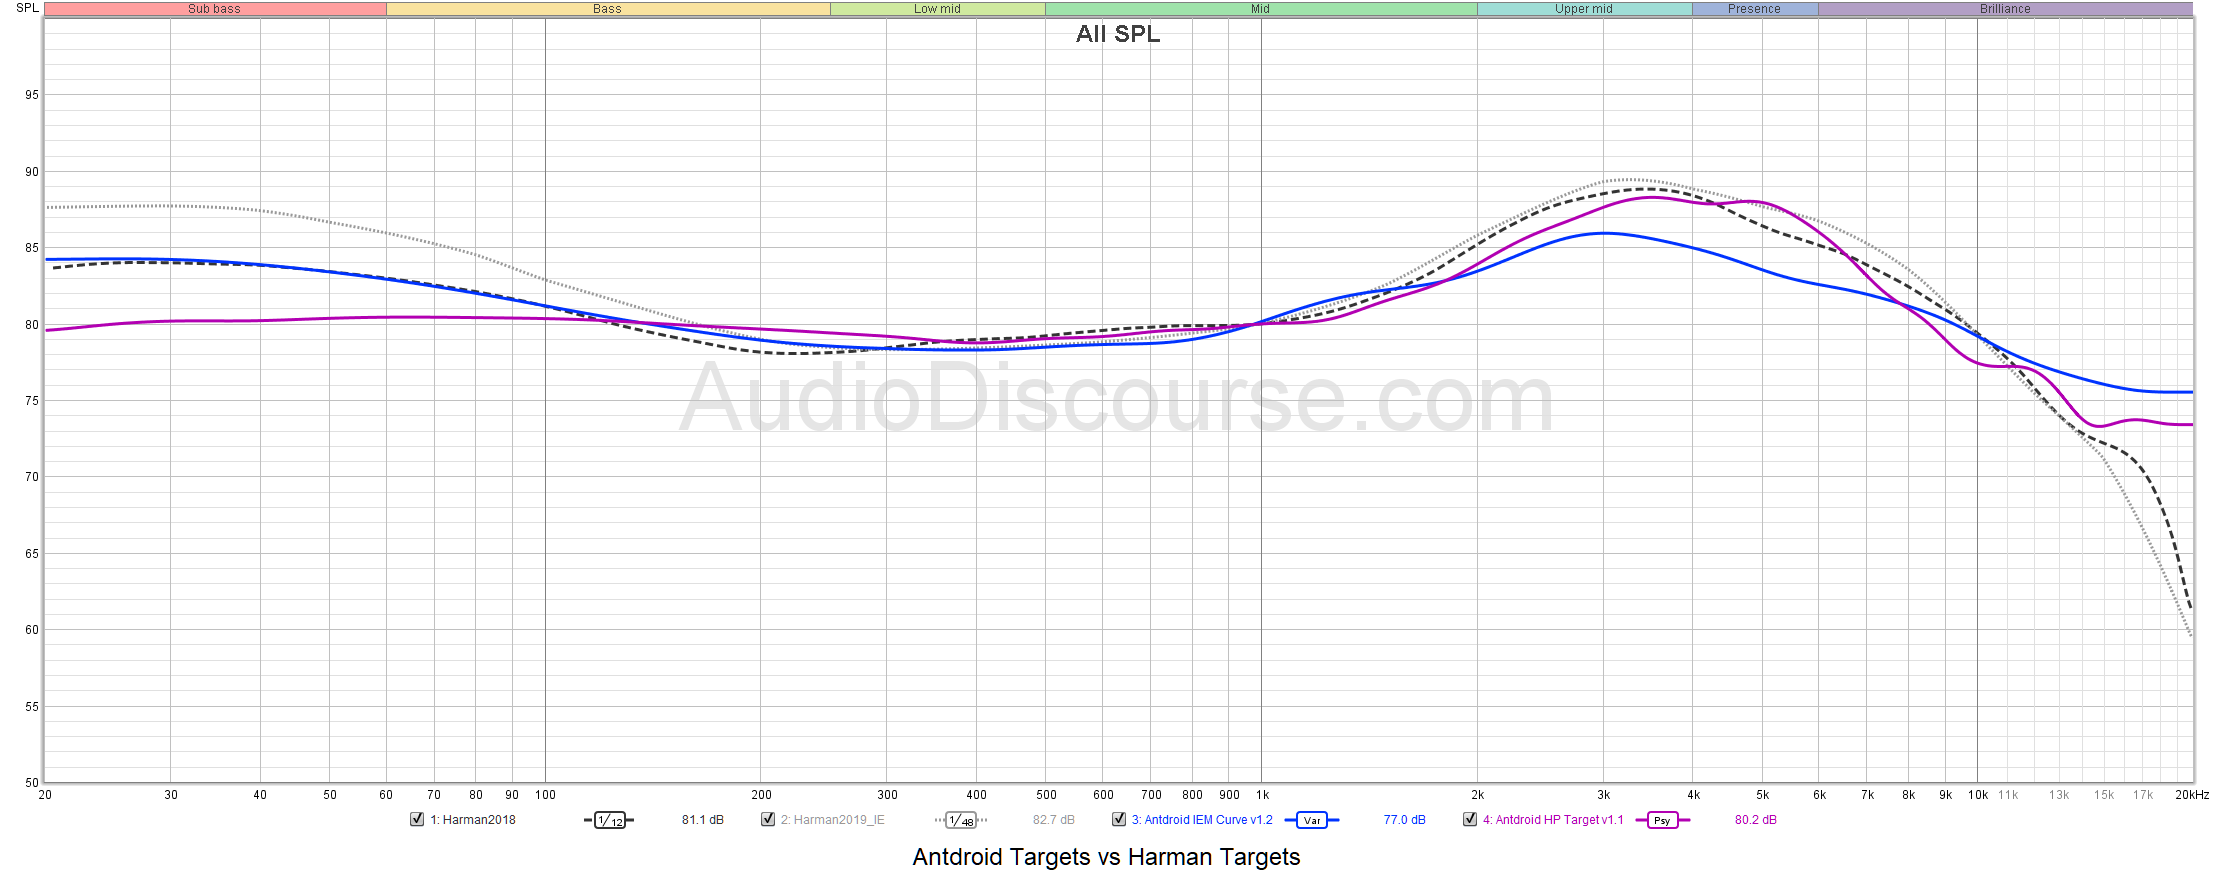
Further Discussion
Now that I have both the headphones and in-ear targets for my own personal preferences, I decided to compare them head-to-head and with the Harman International research preference curves. The results are pretty interesting.
First, I figured that IEMs had a larger bass shelf gain than headphones, but it is also interesting to see that the Harman research also measured similar gains in the bass shelf for their IEM curves versus the headphone curve. Both Harman targets had more bass gain than my personal liking, but the differences of their OE and IE targets trend similarly.
So, the question that comes to mind is why do I, and most other people (it seems), need more bass gain in an in-ear monitor than a larger over-the-ear headphone? Is it because of the driver size and physics? Is it the ability to feel the vibration of the low end rumble of bass/sub-bass?
I feel it has to do with the “feels,” but this is an area I’d like to learn a little bit more about later.
Until then, here’s the target curves for your own use if you’d like. They are raw text files which can be imported into Excel, Room EQ Wizard, ARTA, or your favorite data manipulation software tool.
Downloads
[ Antdroid’s Headphone Target Curve v1.1 [UPDATED]
](https://drive.google.com/file/d/1t4e-vMEUfW0XK0a-Q1utmYFiUxj0ABxV/view?usp=sharing)
Antdroid’s IEM Target Curve v1.2
Basic Usage Instructions
In Room EQ Wizard, you can import this into its own MDAT file by opening REW, and then clicking File -> Import -> Frequency Response and then locate and choose the target file.

If you want to use it as a Target Curve for using REQ’s EQ Generation Tool, click Preferences -> Preferences and choose the House Curve tab

In the Curve Data input, click Clear Curve , and then Browse and choose the txt file.
Then click the EQ Button on the main screen, and it’ll automatically load the Antdroid target as the default house curve for EQing the current measurement data to. You can then click Target Settings, and click Calculate Target Level from Response to automatically align the House Curve to the measurement data.

Make your filters and enjoy!
11 Likes
Great work, and kudos for making it available in computer readable form!
2 Likes
Made a couple edits based on getting a better calibration file to be more in-line with 43AG’s real rig thanks to Crinacle. It adds a little more qty to the 3-7K region for over-ear headphones

Headphone Curve v1.1

3 Likes
I have to note a bit that you can (I think you should) use the filter tasks to improve the quality of the equalization abit.
Well of course I did. Target curve shouldn’t be some random jaggedy line. 
That said the avg of graphs is pretty smooth, surprisingly.
I use psychoacoustic almost all the time when eqing.
2 Likes
I think you should mention it in the article, as I don’t see a lot of people digging into REW for equalization yet so they don’t know about the existence of Modal Task.
While we are at it, here is my target curve:
A post was merged into an existing topic: DSP, EQ and other Plug-Ins
Finally got back to working on measurement comparison tool.
Took the easy exploratory route and did headphones first sinec I have less measured on the current rig.
4 Likes
Check out the new Goldensound video on not trusting measurements:

7 Likes

A recent video from Jude over at head-fi. Essentially what they’re doing here is converting a physical measurement to a perceptual… index of sorts, with the intention of devising a better way of judging a product than just looking at target adherence/deviation.
What I find interesting about this (even though I have some quibbles), is that it affirms the idea that there’s a lot more to what counts for good/bad than frequency response shown in relation to a target may indicate.
Now… my take here isn’t that we shouldn’t be looking at frequency response, but rather that existing and traditional analysis of it when assessing products is incomplete, and I believe we could still come to a point where we can look at FR and say “this combination of features may contribute to X experience”. Whereas what it seems these guys are doing is saying “frequency response is one thing, but let’s take a look at how this stuff is perceived, and model it that way” - essentially… skipping the step of FR analysis altogether and going straight to human perception.
At a minimum, in my view this is a better way of evaluating headphones than say, using Harman’s statistical model that predicts listener preference. It’s more accommodating of various FR features that may contribute to a good experience that aren’t easily identifiable in FR vs a target, meaning fine-grained elements that the statistical model can’t account for aren’t an issue.
Anyway, I’m more curious about where we go with this, or how it may be useful for an evaluative process.
2 Likes
I suggested years ago that using some sort of learning model and training it over some set of labelled headphones against either test tracks or just the FR curve would give you a good indication very quickly if the FR Curve is sufficient.
If you used some sort of decision tree, you could probably even establish where the important components in the FR curves actually are.
The issue is the labelling, and getting sufficient training data.
It’s an interesting approach, I do like that they break done specific aspects of the presentation, though I’d be interested to see how much agreement there is on the terms.
It’s interesting to see it pitched as a starting point for golden ears to do final tuning.
Not sure I agree with it as a review tool, it’s an interesting idea, but as with all other metrics, people are going to focus on the numbers and not understand the limitations of the approach.
1 Like
been saying this all this time but nobody listened
Mary’s Room

People really gotta clarify what exactly their objective is. Is it to figure out what gear they want? Or is it to drool over numbers?
Solution that’s the most helpful for end-users who just want to try out what gear works for them imho is a brick and mortar store or a rental paradigm like what many Asian countries are doing right now.
1 Like
Two things…
I LOVE Frank Jackson’s paper on this that you’ve referenced, and I use this argument all the time - that knowledge of something perceptual can’t truly be claimed until it is experienced.
The second is that I still think it’s super valuable to have a predictive perceptual index, which is essentially what they’re trying to do here. I think there are issues with it, but it’s a really interesting concept that aims to solve some of the common problems with existing indices.
Adding this here so folks can see the new way we’re showing measurements:

4 Likes